Configuring Diagnostic Settings
Sign in during Public Preview to get the Team plan free, plus an early-adopter discount when we launch. Sign in
Configuring Diagnostic Settings
This guide shows you how to use a Diagnostic Setting to send a resource's logs to a Log Analytics Workspace against Locally. We'll point a Web App's request logs at a workspace, send it a request, then query the workspace to see it arrive - all with the Azure CLI.
Before you start
- The Azure CLI (
az) installed. - Locally installed, with Locally Setup completed.
- Docker or Podman running, since the Web App runs as a container.
1. Start Locally
Firstly, we need to launch Locally which we can do from a terminal by running:
                $


            locally build
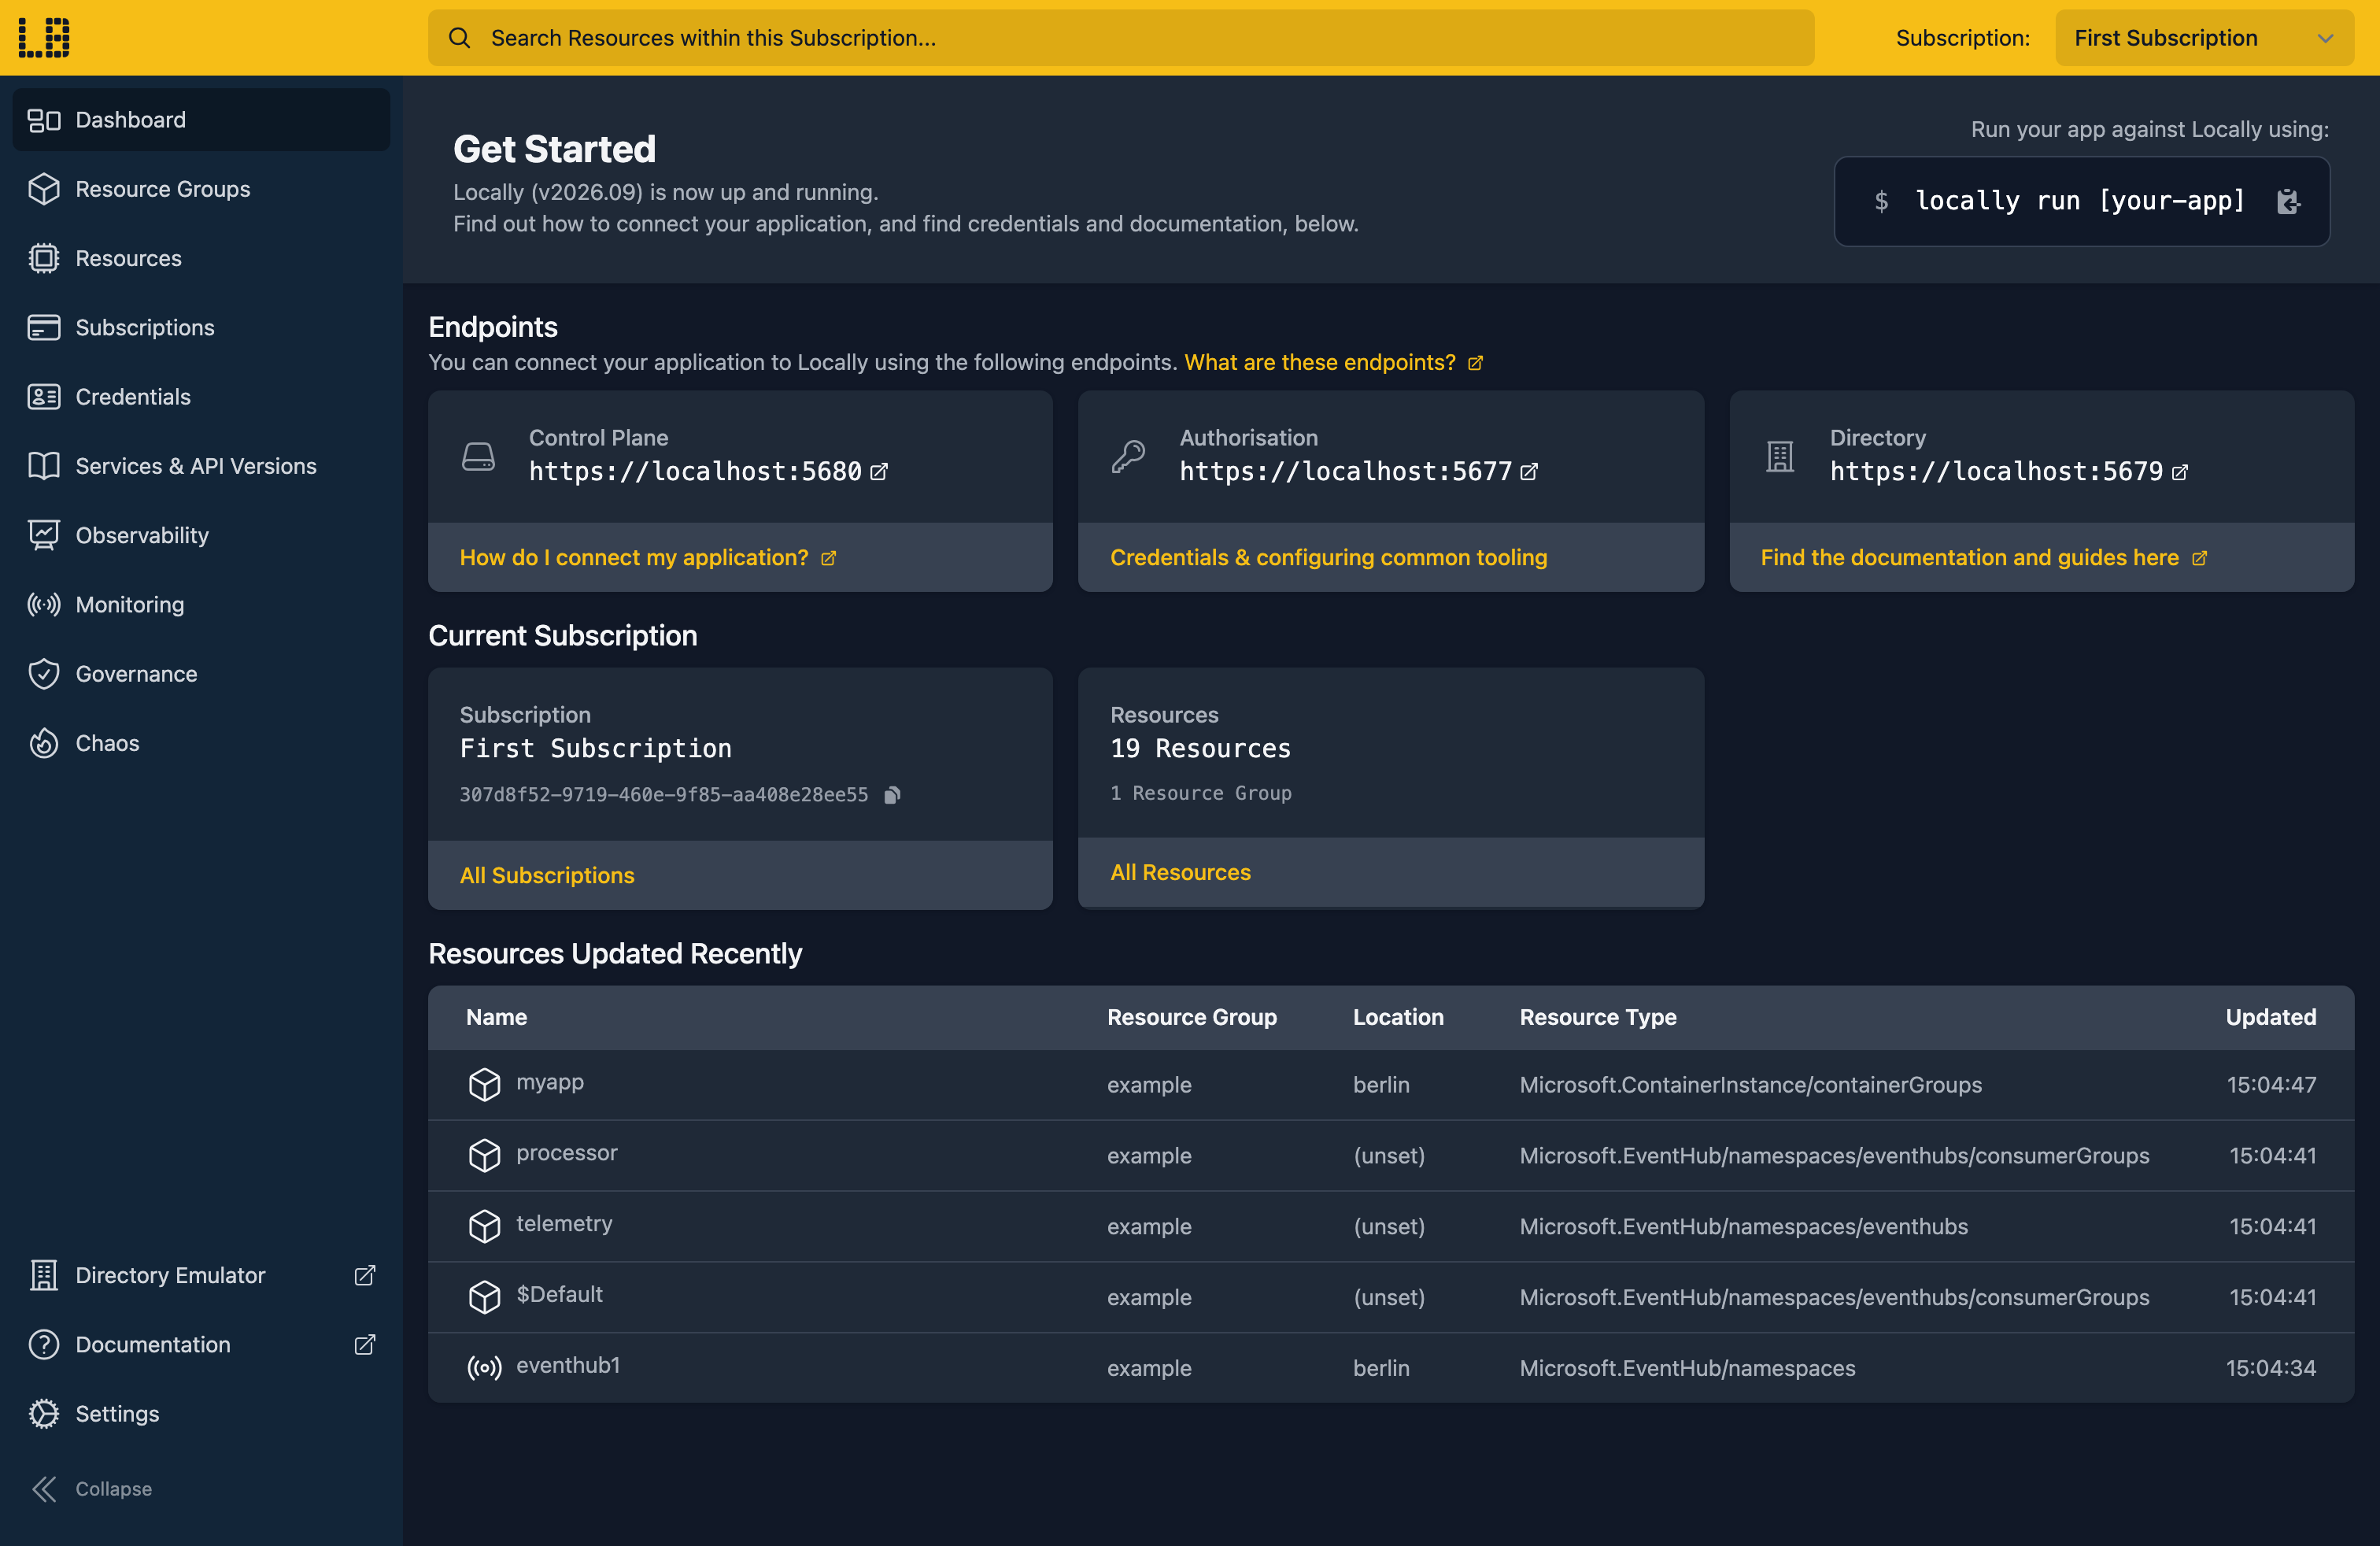
Once Locally has started, the Locally Dashboard will open automatically:
2. Create a Resource Group
Next we can create the Resource Group:
                $


            locally run az group create -n sample-diagnostics -l berlin
There's two things to note here:
- The Azure CLI supports Automatic Configuration, meaning that it can automatically be configured to work against Locally just by prefixing commands with
locally run. - Locally intentionally uses a different set of locations to Azure as a safety precaution, so that you can be confident you're deploying against Locally rather than regular Azure. You can also configure Locally to use the Azure locations too, but you'll want to be extra sure that you're prefixing commands with
locally runwhen you do.
3. Create the Workspace
The logs need somewhere to go, so let's create a Log Analytics Workspace:
                $


            locally run az monitor log-analytics workspace create -g sample-diagnostics -n sample-diag-workspace -l berlin --query "{name:name, customerId:customerId, sku:sku.name, retentionInDays:retentionInDays}"
{
  "customerId": "e529fa93-3736-44bf-9369-0413f2c2982e",
  "name": "sample-diag-workspace",
  "retentionInDays": 30,
  "sku": "PerGB2018"
}
The Diagnostic Setting refers to the workspace by its resource ID, so let's keep hold of that:
                $


            export WORKSPACE_ID=$(locally run az monitor log-analytics workspace show -g sample-diagnostics -n sample-diag-workspace --query id -o tsv)
4. Create a Web App
Now we need a resource that produces logs. A Web App needs an App Service Plan to run on:
                $


            locally run az appservice plan create -g sample-diagnostics -n sample-diag-plan -l berlin --sku B1 --is-linux
Then we can create the Web App itself, running a small container that echoes back each request it receives:
                $


            locally run az webapp create -g sample-diagnostics -n samplediagapp1 --plan sample-diag-plan --container-image-name traefik/whoami:latest --query "{name:name, state:state, host:defaultHostName}"
{
  "host": "samplediagapp1.furnace.locally:5663",
  "name": "samplediagapp1",
  "state": "Running"
}
And keep hold of its resource ID too, since that's what the Diagnostic Setting attaches to:
                $


            export WEB_APP_ID=$(locally run az webapp show -g sample-diagnostics -n samplediagapp1 --query id -o tsv)
5. Create the Diagnostic Setting
Let's send the Web App's HTTP and console logs to the workspace:
                $


            locally run az monitor diagnostic-settings create -n send-to-logs --resource "$WEB_APP_ID" --workspace "$WORKSPACE_ID" --logs '[{"category":"AppServiceHTTPLogs","enabled":true},{"category":"AppServiceConsoleLogs","enabled":true}]' --query "{name:name, workspaceId:workspaceId, logs:logs}"
{
  "logs": [
    {
      "category": "AppServiceHTTPLogs",
      "enabled": true
    },
    {
      "category": "AppServiceConsoleLogs",
      "enabled": true
    }
  ],
  "name": "send-to-logs",
  "workspaceId": "/subscriptions/307d8f52-9719-460e-9f85-aa408e28ee55/resourceGroups/sample-diagnostics/providers/Microsoft.OperationalInsights/workspaces/sample-diag-workspace"
}
We can list the Diagnostic Settings on the Web App, along with the categories each one sends:
                $


            locally run az monitor diagnostic-settings list --resource "$WEB_APP_ID" --query "[].{Name:name, Categories:join(', ', logs[?enabled].category)}" -o table
Name          Categories
------------  -----------------------------------------
send-to-logs  AppServiceHTTPLogs, AppServiceConsoleLogs
Heads up
az monitor diagnostic-settings categories list comes back empty, and a category name is accepted without being checked. Azure's supported resource log categories list has the names for each resource type.6. Send the Web App a request
Now we need something to log. Let's send the Web App a request:
                $


            curl -s -o /dev/null -w "%{http_code}\n" "https://$(locally run az webapp show -g sample-diagnostics -n samplediagapp1 --query defaultHostName -o tsv)/hello"
200If you get a 502, the container is still starting - give it a few seconds and try again.
7. Query the Workspace
Queries identify the workspace by its workspace ID (customerId) rather than its resource ID:
                $


            export WORKSPACE_GUID=$(locally run az monitor log-analytics workspace show -g sample-diagnostics -n sample-diag-workspace --query customerId -o tsv)
Then we can look for the request in the AppServiceHTTPLogs table:
                $


            locally run az monitor log-analytics query -w "$WORKSPACE_GUID" --analytics-query "AppServiceHTTPLogs | project TimeGenerated, CsMethod, CsUriStem, ScStatus" --query "[].{Time:TimeGenerated, Method:CsMethod, Path:CsUriStem, Status:ScStatus}" -o table
Time                  Method    Path    Status
--------------------  --------  ------  --------
2026-10-05T15:54:06Z  GET       /hello  200
Logs usually arrive within a few seconds, so if the table is empty, wait a moment and run the query again.
Note
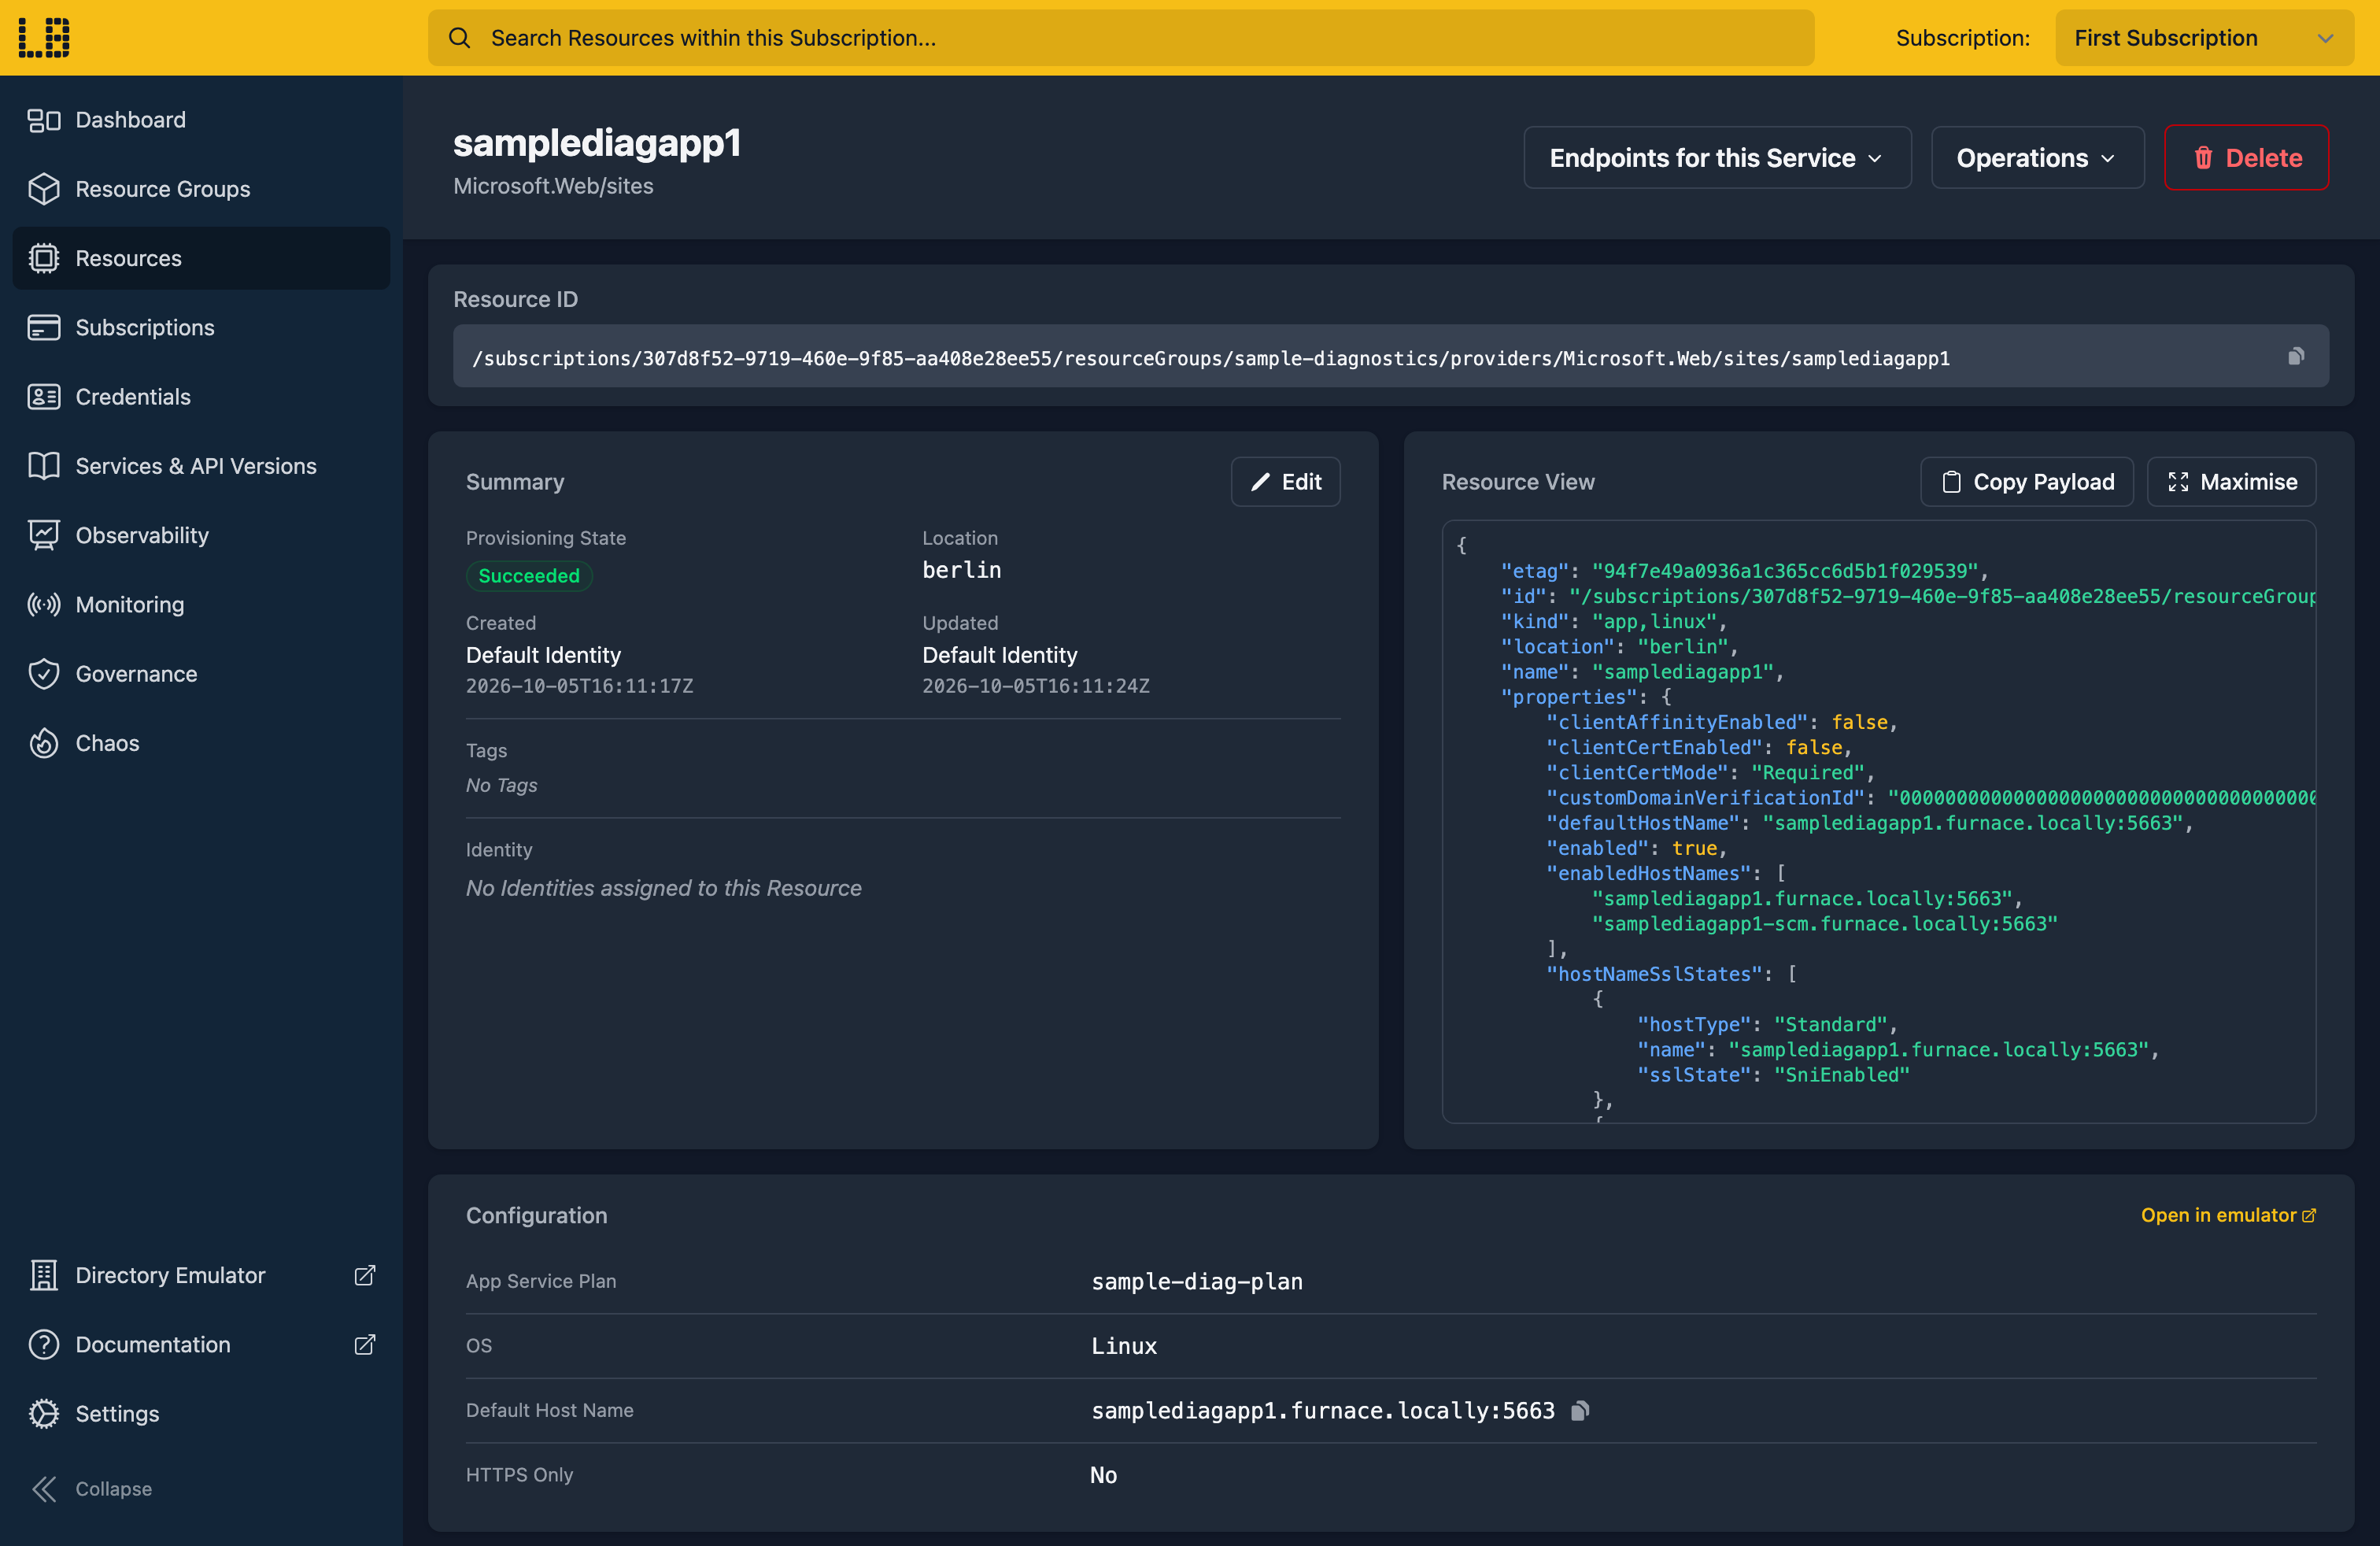
AzureActivity table.We can see the Web App in the Locally Dashboard too:
Doing this with other tooling
Whilst this guide used the Azure CLI, Diagnostic Settings work the same way through any of the tooling that Locally supports - a Microsoft.Insights/diagnosticSettings resource in HashiCorp Terraform or OpenTofu, Pulumi, Bicep or an ARM Template all provision against Locally in the same way, with only the location changed.
Next steps
Only the Activity Log, Web Apps and Function Apps send logs this way so far - the Log Analytics Emulator has the details. To be told when something happens rather than query for it, see Alerts.
Should you encounter any issues, please take a look at the troubleshooting section.
Sign in during Public Preview to get the Team plan free, plus an early-adopter discount when we launch. Sign in
