Provisioning Application Insights
Sign in during Public Preview to get the Team plan free, plus an early-adopter discount when we launch. Sign in
Provisioning Application Insights
This guide shows you how to provision an Application Insights component against Locally and send telemetry to it. As with the other guides we're going to use the Azure CLI, but the same resources can be provisioned with HashiCorp Terraform, Pulumi or Bicep too.
Before you start
- The Azure CLI (
az) installed. - Locally installed, with Locally Setup completed.
1. Start Locally
Firstly, we need to launch Locally which we can do from a terminal by running:
                $


            locally build
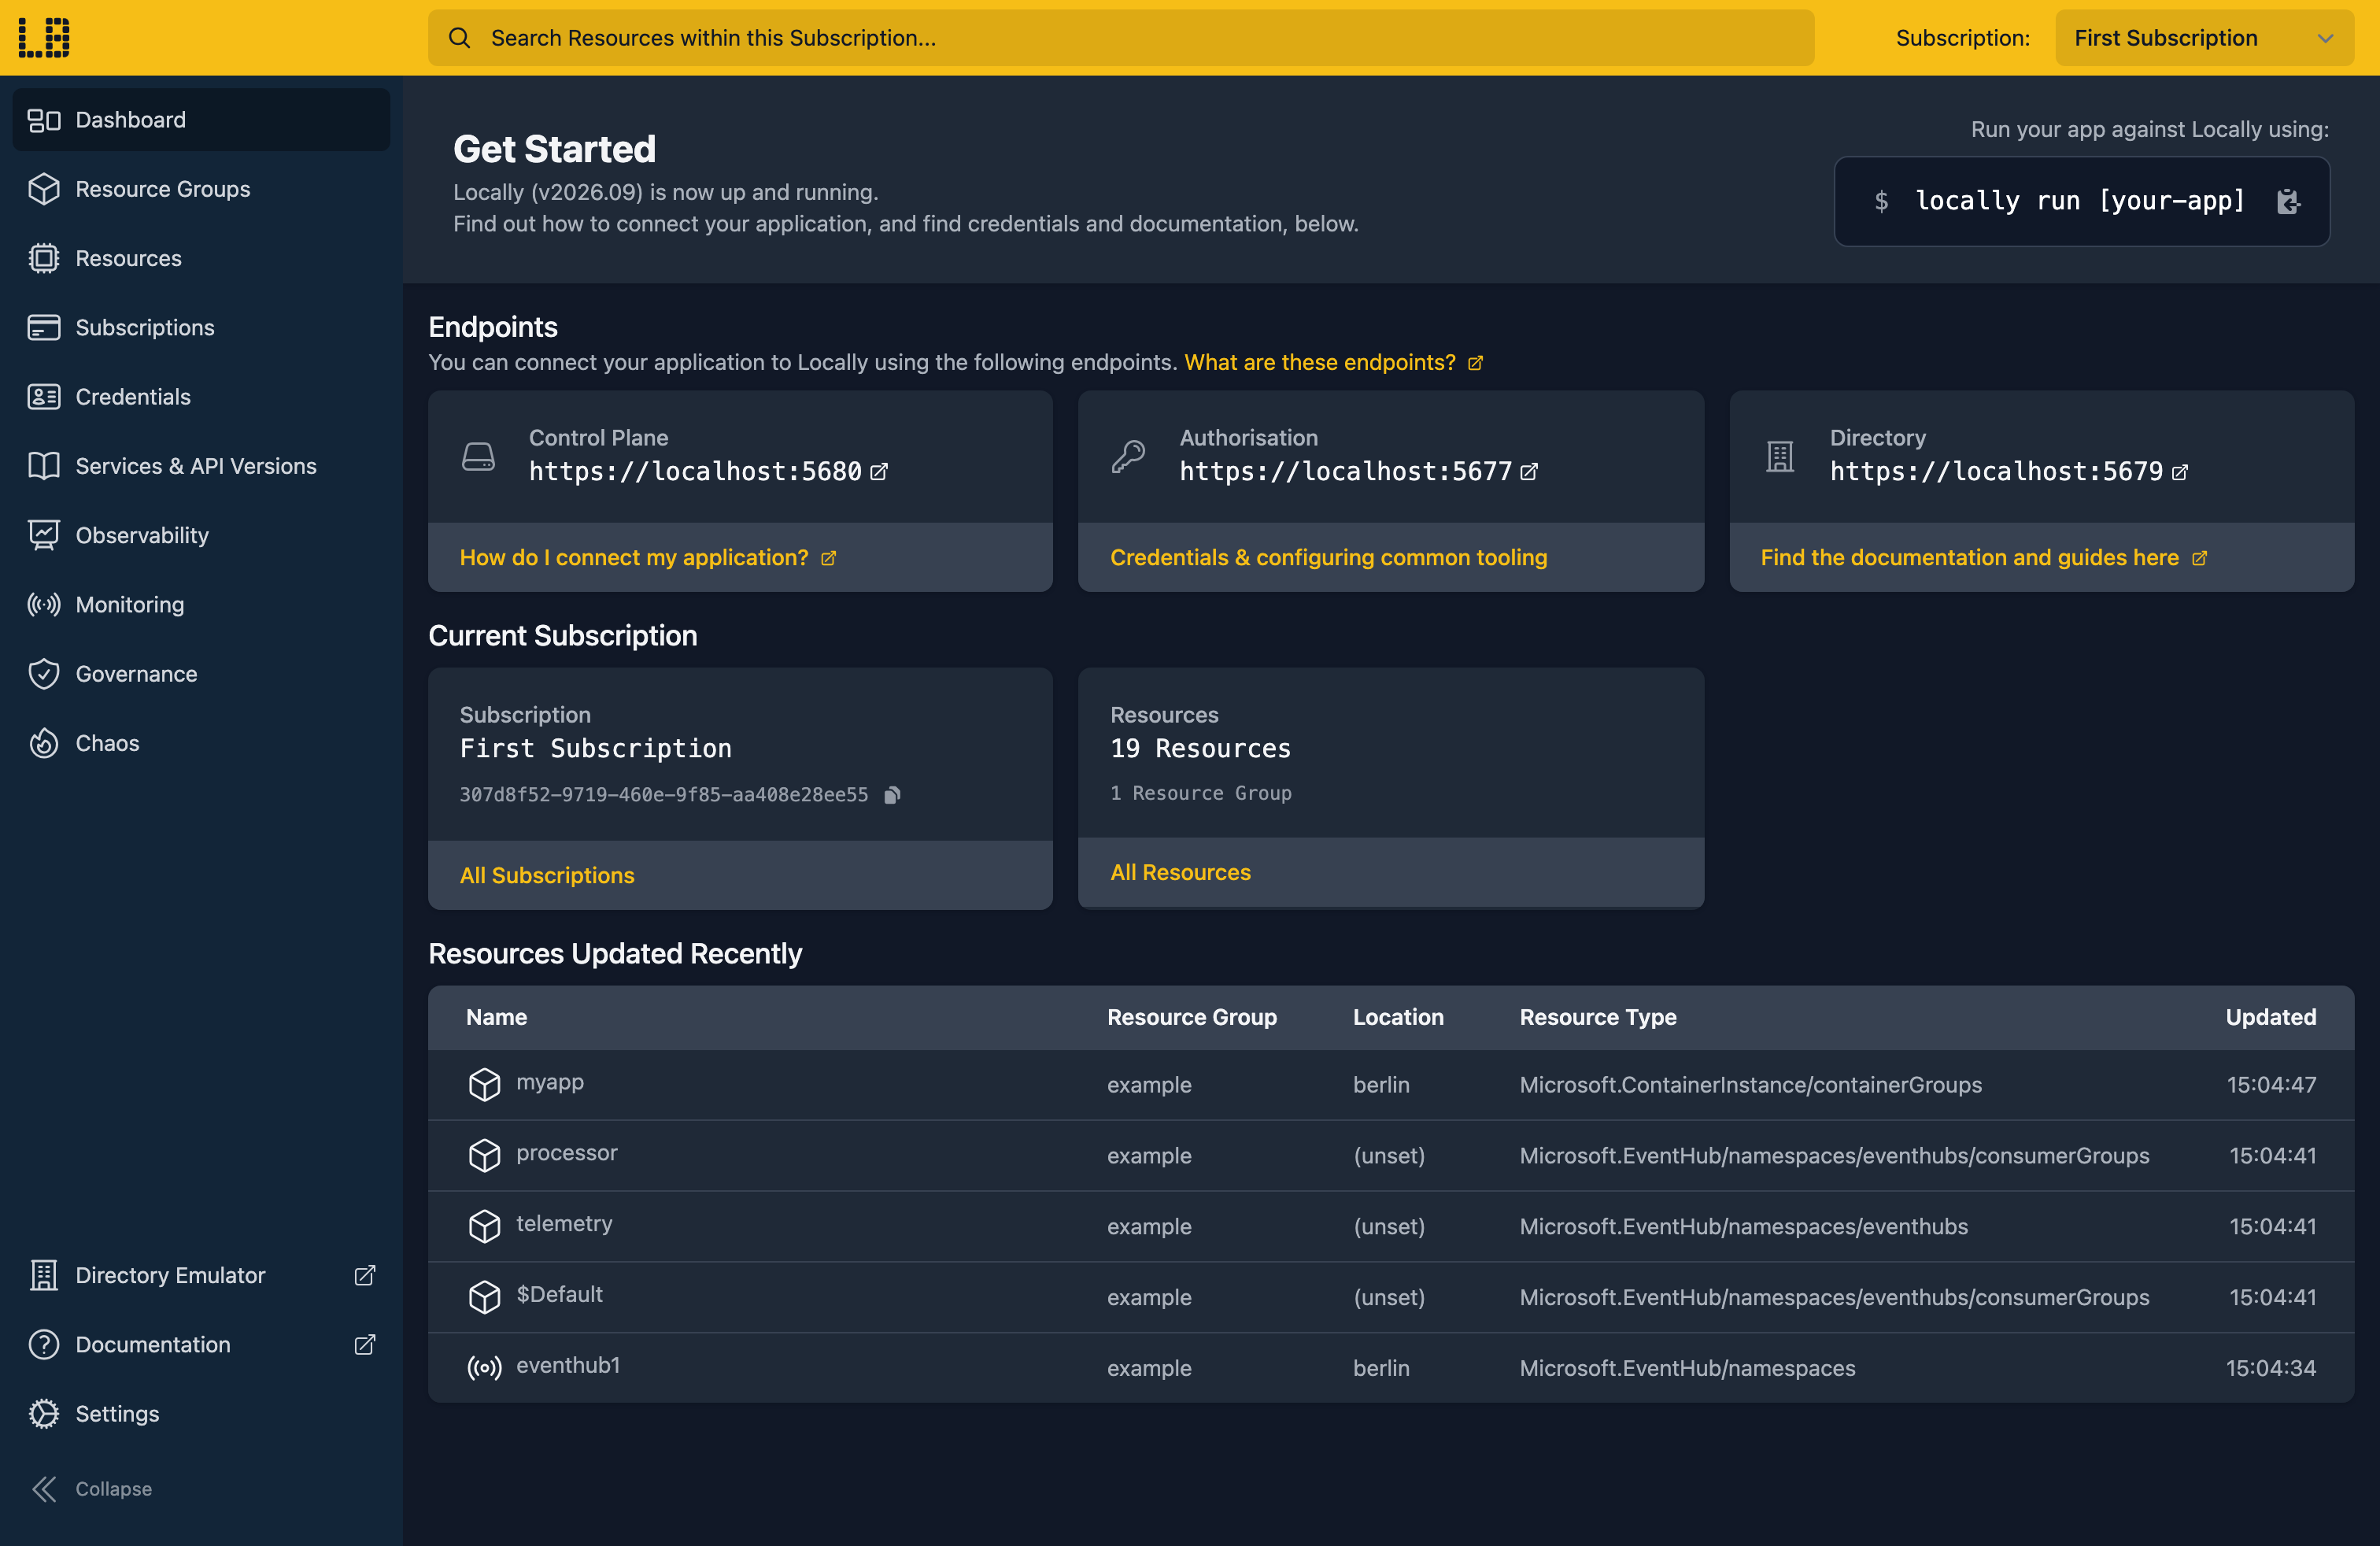
Once Locally has started, the Locally Dashboard will open automatically:
2. Create a Resource Group
Next we can create the Resource Group:
                $


            locally run az group create -n sample-resources -l berlin
There's two things to note here:
- The Azure CLI supports Automatic Configuration, meaning that it can automatically be configured to work against Locally just by prefixing commands with
locally run. - Locally intentionally uses a different set of locations to Azure as a safety precaution, so that you can be confident you're deploying against Locally rather than regular Azure. You can also configure Locally to use the Azure locations too, but you'll want to be extra sure that you're prefixing commands with
locally runwhen you do.
3. Create the component
With the Resource Group in place, we can create the component:
                $


            locally run az monitor app-insights component create -g sample-resources -a sampleinsights1 -l berlin --application-type web
{
  "note": "some fields skipped for brevity",

  "appId": "88000c3d-4835-4e89-b001-6517abfd48bd",
  "applicationType": "web",
  "connectionString": "InstrumentationKey=2aa26f4a-00af-402c-8be8-92703bb91903;IngestionEndpoint=https://ingest.appinsights.locally:5668/;LiveEndpoint=https://live.appinsights.locally:5668/;ApplicationId=88000c3d-4835-4e89-b001-6517abfd48bd",
  "instrumentationKey": "2aa26f4a-00af-402c-8be8-92703bb91903",
  "location": "berlin",
  "name": "sampleinsights1",
  "provisioningState": "Succeeded",
  "retentionInDays": 90,
  "type": "Microsoft.Insights/components"
}
The connectionString is the field that matters. It's the one thing the Azure Monitor SDKs need, and Locally builds it the same way Azure does - an instrumentation key, plus the endpoints telemetry is sent to. Those endpoints are appinsights.locally hostnames served by Locally's own DNS server, pointing at the emulator on your machine.
Note
4. Read the connection string back
To point an application at the component, read the connection string back:
                $


            export APPLICATIONINSIGHTS_CONNECTION_STRING=$(locally run az monitor app-insights component show -g sample-resources -a sampleinsights1 --query connectionString -o tsv)
That's the environment variable the Azure Monitor SDKs and the OpenTelemetry distros read by default, so an application started in this shell will find it without any further configuration.
5. Send telemetry
You don't need an instrumented application to prove the path works, though. The ingestion endpoint takes the same payload the SDKs send, so we can post one by hand.
First the instrumentation key:
                $


            export IKEY=$(locally run az monitor app-insights component show -g sample-resources -a sampleinsights1 --query instrumentationKey -o tsv)
Then a single custom event:
                $


            curl -sk -X POST https://ingest.appinsights.locally:5668/v2/track -H "Content-Type: application/json" -d "{\"name\":\"Microsoft.ApplicationInsights.Event\",\"time\":\"$(date -u +%Y-%m-%dT%H:%M:%SZ)\",\"iKey\":\"${IKEY}\",\"data\":{\"baseType\":\"EventData\",\"baseData\":{\"ver\":2,\"name\":\"SampleEvent\"}}}"
{"itemsReceived":1,"itemsAccepted":1,"errors":[]}itemsAccepted: 1 is the emulator confirming it took the event. A wrong key is rejected the way Azure rejects it, rather than being silently dropped:
{"itemsReceived":1,"itemsAccepted":0,"errors":[{"index":0,"statusCode":400,"message":"invalid instrumentation key"}]}Note
curl here isn't prefixed with locally run - it's talking to the ingestion endpoint directly rather than to the Azure APIs. Every az command still needs the prefix.Telemetry that would have gone to a shared Application Insights resource stays on your machine, and a wrong key fails while you're still writing the code rather than in production.
6. Create an API key
Applications that read telemetry back - dashboards, or a test asserting on what was recorded - authenticate with an API key rather than the instrumentation key:
                $


            locally run az monitor app-insights api-key create -g sample-resources --app sampleinsights1 --api-key sample-key --read-properties ReadTelemetry
{
  "note": "some fields skipped for brevity",

  "apiKey": "5e6d1c22-3a41-4d92-b1ad-0f5c2e7a94b6",
  "linkedReadProperties": [
    "/subscriptions/.../providers/microsoft.insights/components/sampleinsights1/api"
  ],
  "linkedWriteProperties": [],
  "name": "sample-key"
}
Note
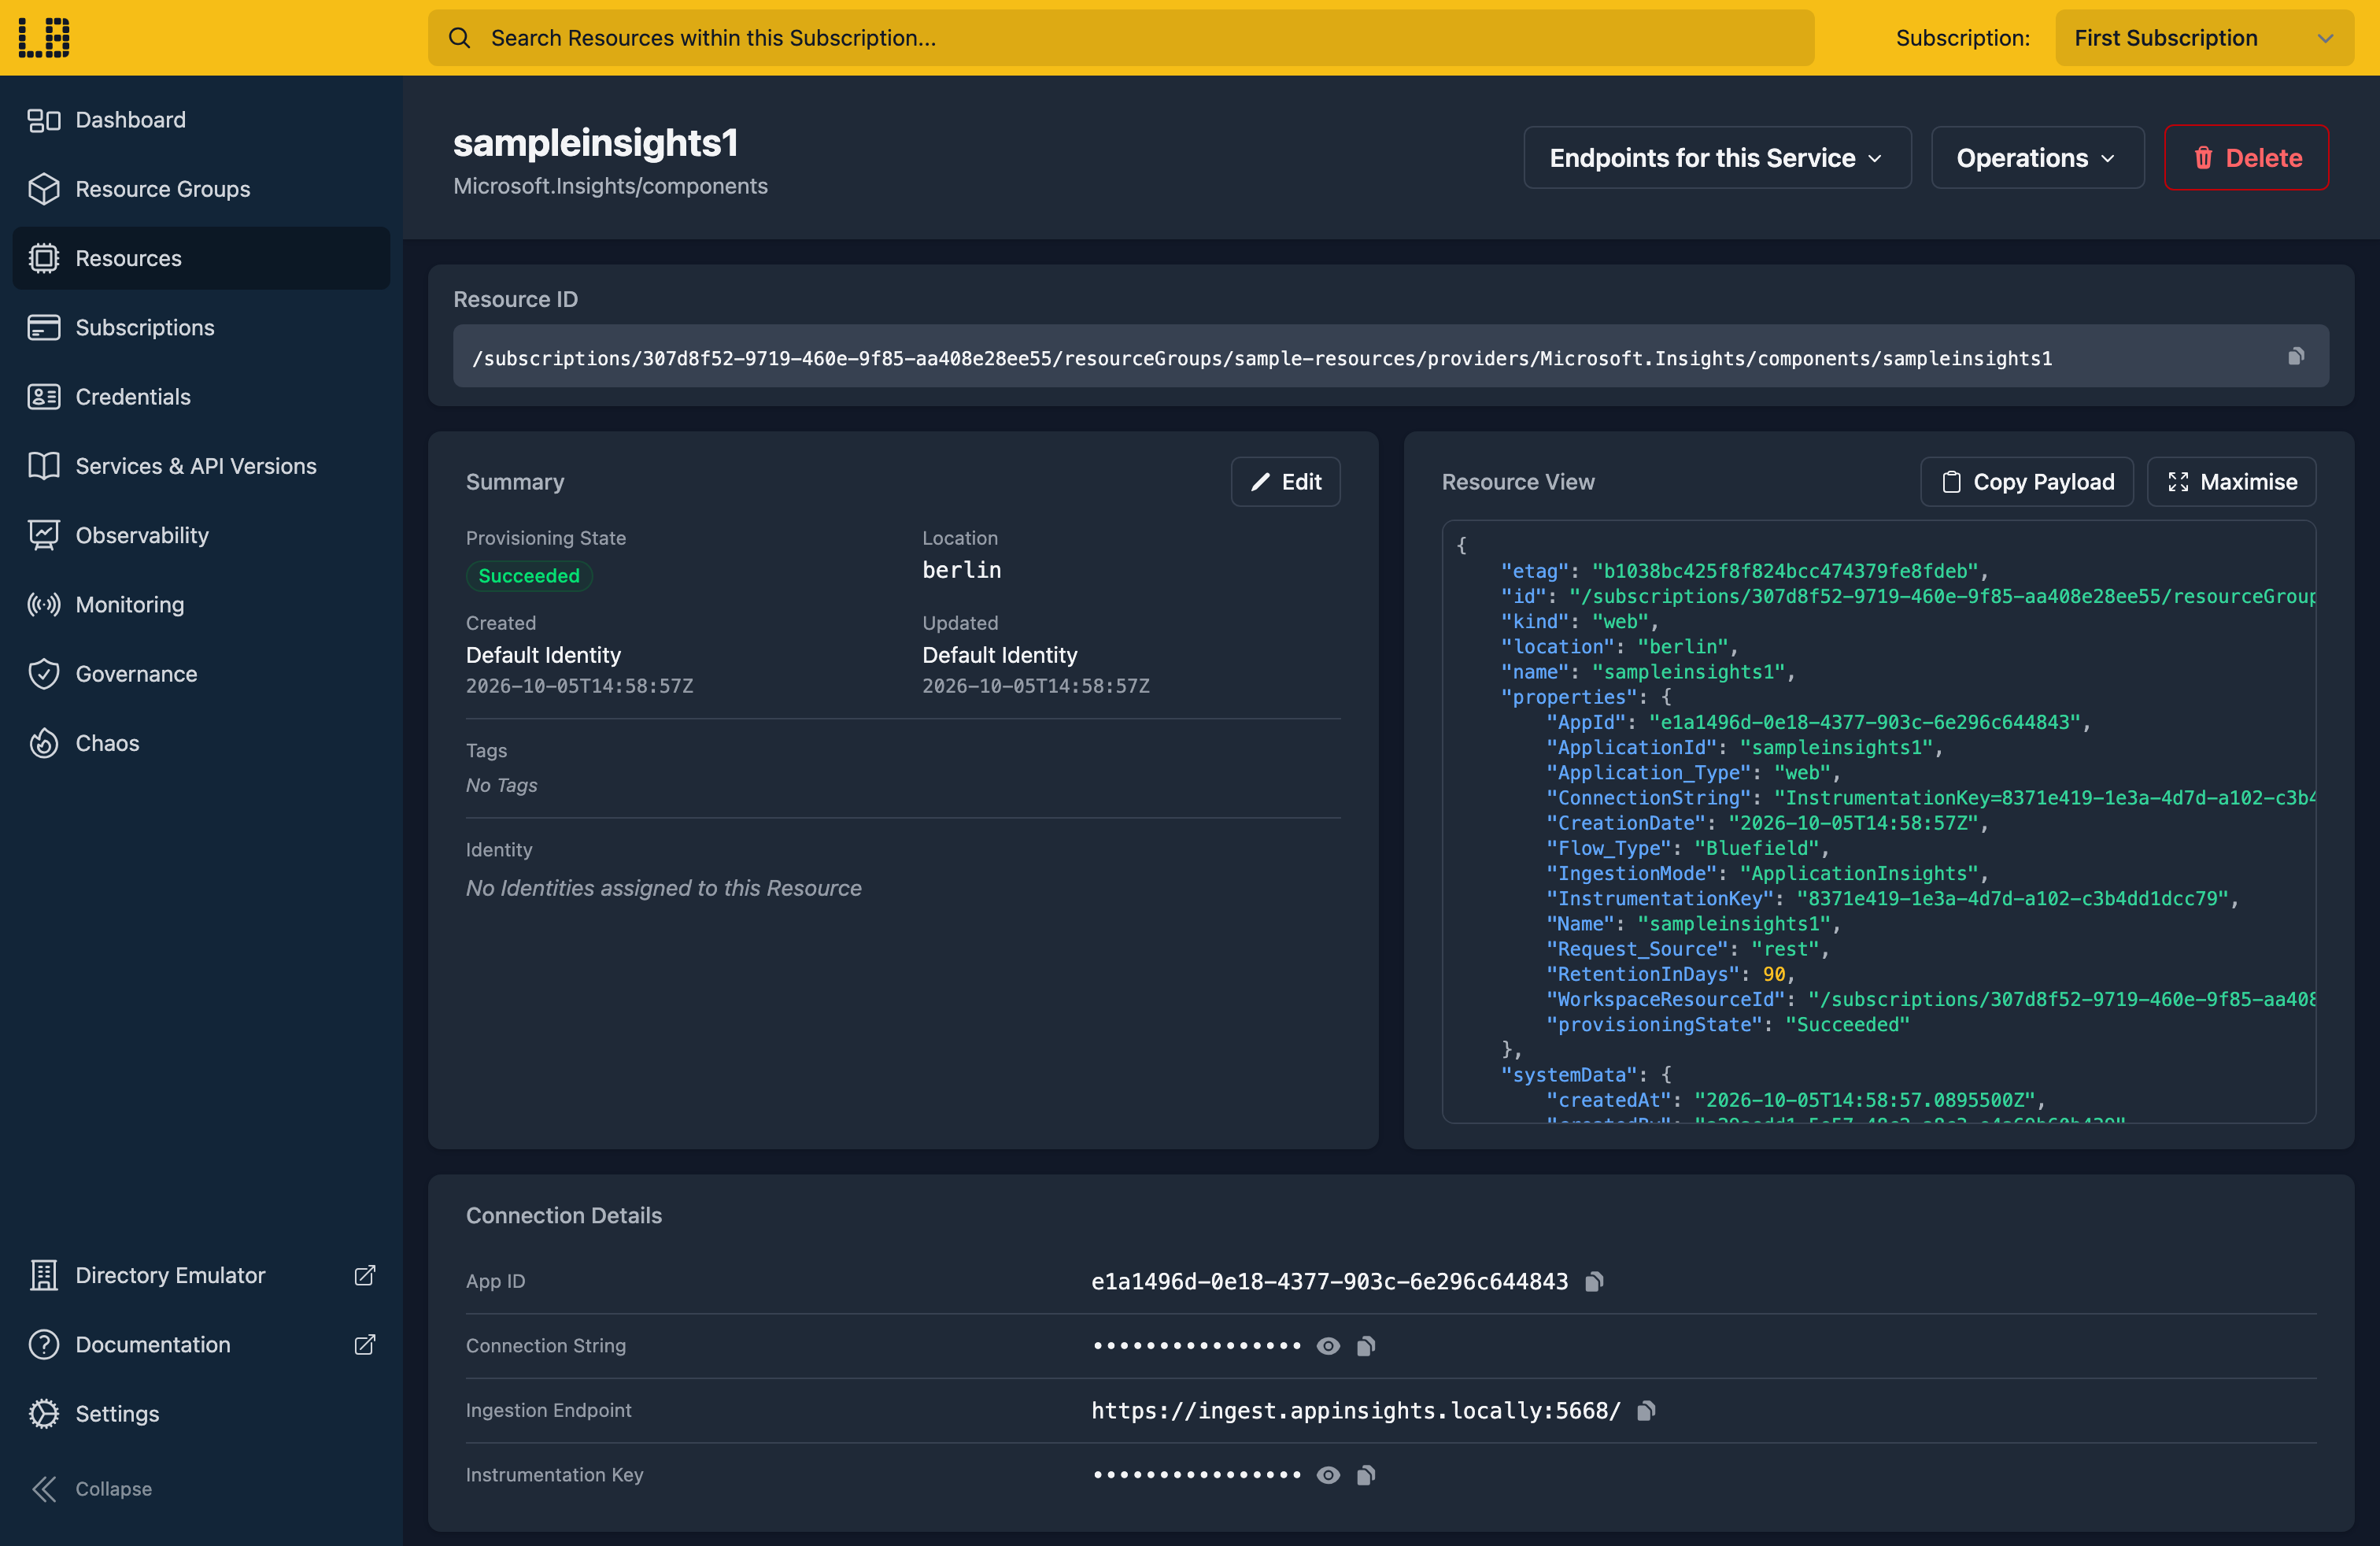
apiKey value is shown once, on creation, and cannot be read back afterwards - the same rule Azure applies. If you lose it, create another.We can see the Application Insights component in the Locally Dashboard too:
7. Tidy up
Finally, we can tidy up. To remove the Resource Group and everything within it:
                $


            locally run az group delete -n sample-resources --yes
There's nothing billable to clean up, since everything ran on your machine, but it's still worth checking your teardown scripts work here before you run them against Azure.
Doing this with other tooling
Whilst this guide used the Azure CLI, Application Insights works the same way through any of the tooling that Locally supports - a Microsoft.Insights/components resource in HashiCorp Terraform or OpenTofu, Pulumi, Bicep or an ARM Template all provision against Locally in the same way, with only the location changed.
The data plane is the same story: point the Azure Monitor SDKs, or an OpenTelemetry exporter, at the connection string above and they send telemetry to Locally exactly as they would to Azure.
Next steps
To see the telemetry your app sends, open the Application Insights Emulator. For logs from your other resources, see Log Analytics Workspace and Diagnostic Settings.
Should you encounter any issues, please take a look at the troubleshooting section.
Sign in during Public Preview to get the Team plan free, plus an early-adopter discount when we launch. Sign in
