Log Analytics Emulator
Sign in during Public Preview to get the Team plan free, plus an early-adopter discount when we launch. Sign in
Log Analytics Emulator
A Log Analytics workspace is where Azure Monitor stores logs - from your applications, your Azure resources and Azure itself - so that you can query them using KQL.
Locally supports both provisioning Log Analytics workspaces and sending logs to them - so you can check that a Data Collection Rule's transformation does what you meant, or that an alert's query actually matches something, before you deploy.
When you provision a workspace in Locally, you can send logs to it and query them using the same APIs, SDKs and az commands you'd use against Azure.
Finding the Emulator
Once a workspace has been created, you can find it under Monitoring in the Locally Dashboard, along with its ID, shared keys, retention and the Application Insights components linked to it.
The Log Analytics Emulator
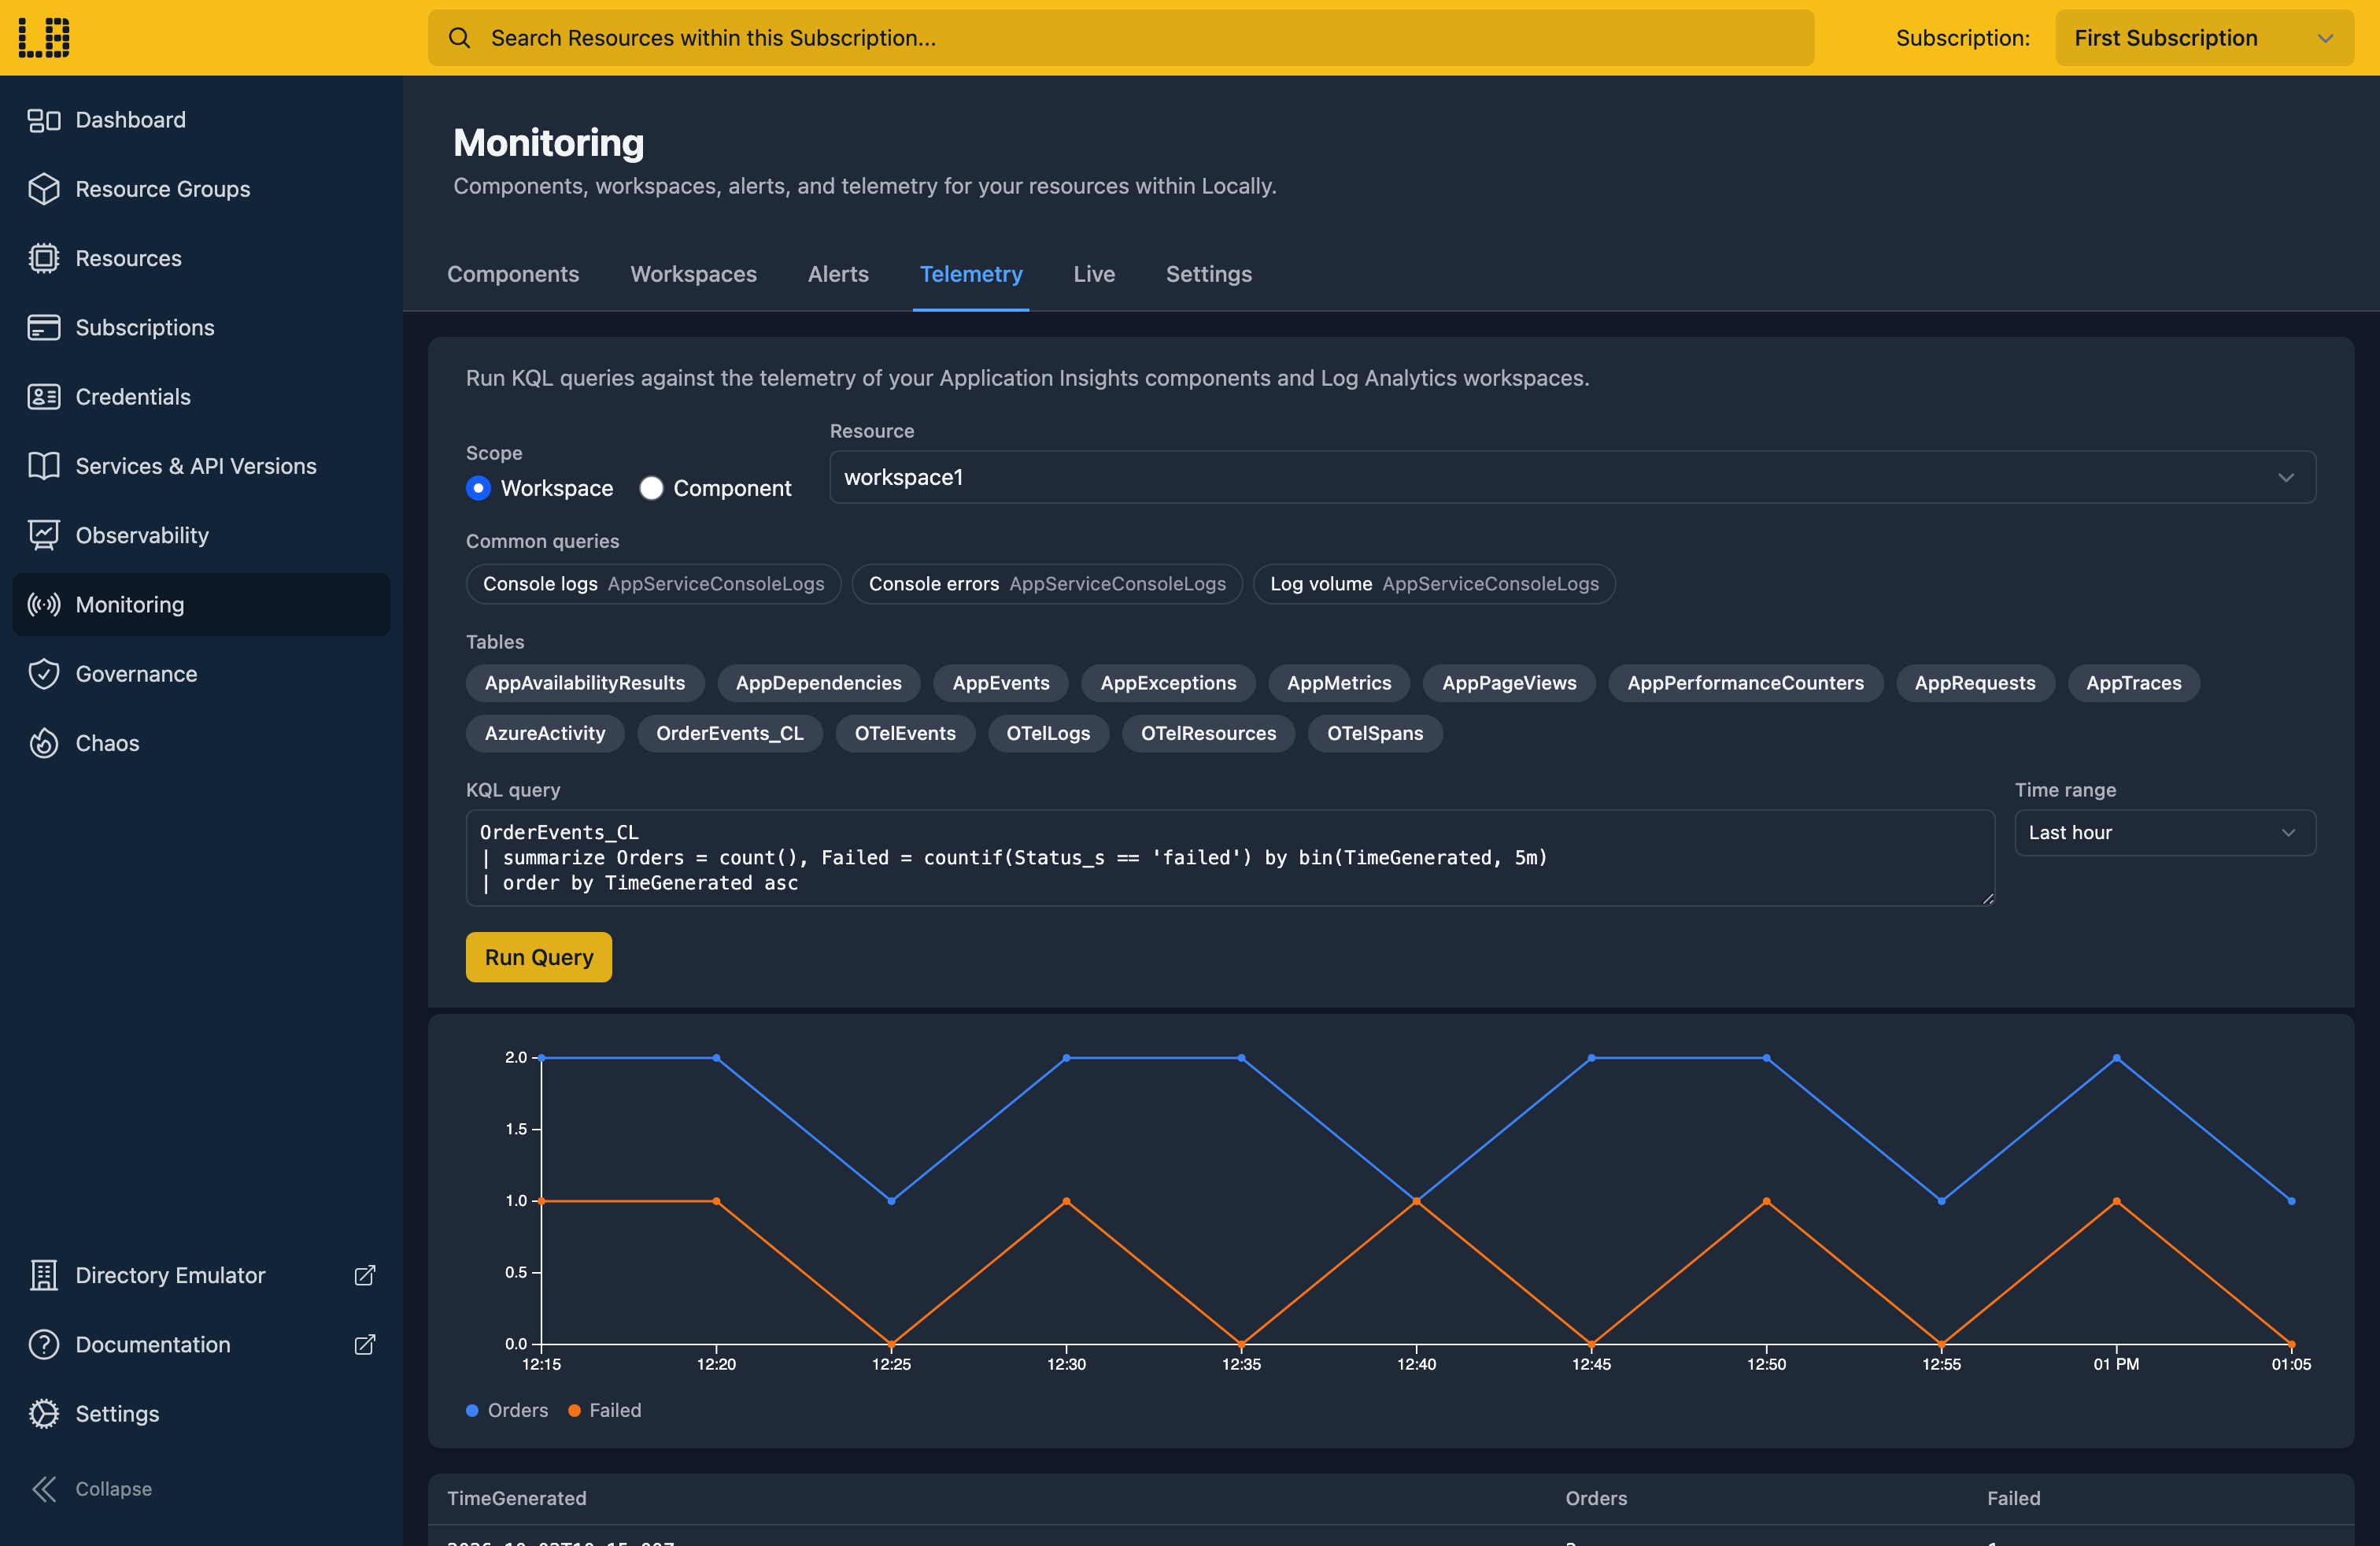
The Telemetry tab is a KQL console for a workspace, listing its tables, with charts for time series:
What's Supported
The Log Analytics emulator supports:
Logs can be sent using a Microsoft Entra token (with the Monitoring Metrics Publisher role) or, for the HTTP Data Collector API, the workspace's shared key. Queries need an Entra token with read access to the workspace. Data Collection Rules also need the Microsoft.Insights plugin.
KQL is run by Locally's own engine, which covers most of what you'd write day-to-day - such as summarize, join, parse, make-series and user-defined functions.
Chaos Engineering (on the Team plan) can throttle, fail or slow down ingestion and queries - so you can check your application copes when Log Analytics doesn't.
Log Analytics also works with Locally's other emulators, as you'd expect - for example:
- Telemetry from the Application Insights Emulator lands in the
App*tables of the component's workspace. - The Activity Log lands in
AzureActivity, once a subscription has a diagnostic setting sending it to the workspace. - Console output from the Web App Emulator lands in
AppServiceConsoleLogs, alongside itsAppServiceHTTPLogs,AppServicePlatformLogsandAppServiceAuthenticationLogs. Function Apps sendFunctionAppLogs, and Container Apps' console output lands inContainerAppConsoleLogs_CL.
Differences from Azure
As of Locally v2026.09.02, the Log Analytics emulator has the following differences from Azure:
- There's no Azure Monitor Agent, so tables like
Heartbeat,Syslog,PerfandContainerLogsstay empty. - Diagnostic settings on other resources (such as Storage or Key Vault) don't send anything yet - only the Activity Log, Web Apps and Function Apps send logs this way.
- The machine learning operators (
autocluster,basket,diffpatterns) and anomaly detection functions aren't supported, andrenderhas no effect. - OTLP metrics aren't accepted - only OTLP logs and traces.
- The archive tier, search jobs, summary rules and data export can be created, but don't do anything.
Should you encounter any issues, please take a look at the troubleshooting section.
Sign in during Public Preview to get the Team plan free, plus an early-adopter discount when we launch. Sign in
