Provisioning Alerts and Action Groups
Sign in during Public Preview to get the Team plan free, plus an early-adopter discount when we launch. Sign in
Provisioning Alerts and Action Groups
This guide shows you how to set up an Action Group with a webhook and an Activity Log alert against Locally, then trigger the alert and watch it arrive at the webhook. As with the other guides we're going to use the Azure CLI, but the same resources can be provisioned with HashiCorp Terraform, Pulumi or Bicep too.
Before you start
- The Azure CLI (
az) installed. - Locally installed, with Locally Setup completed.
- Either Podman or Docker installed and running - we'll use it to run a small web server that receives the alert. The commands below use
podman; with Docker, swap indocker.
1. Start Locally
Firstly, we need to launch Locally which we can do from a terminal by running:
                $


            locally build
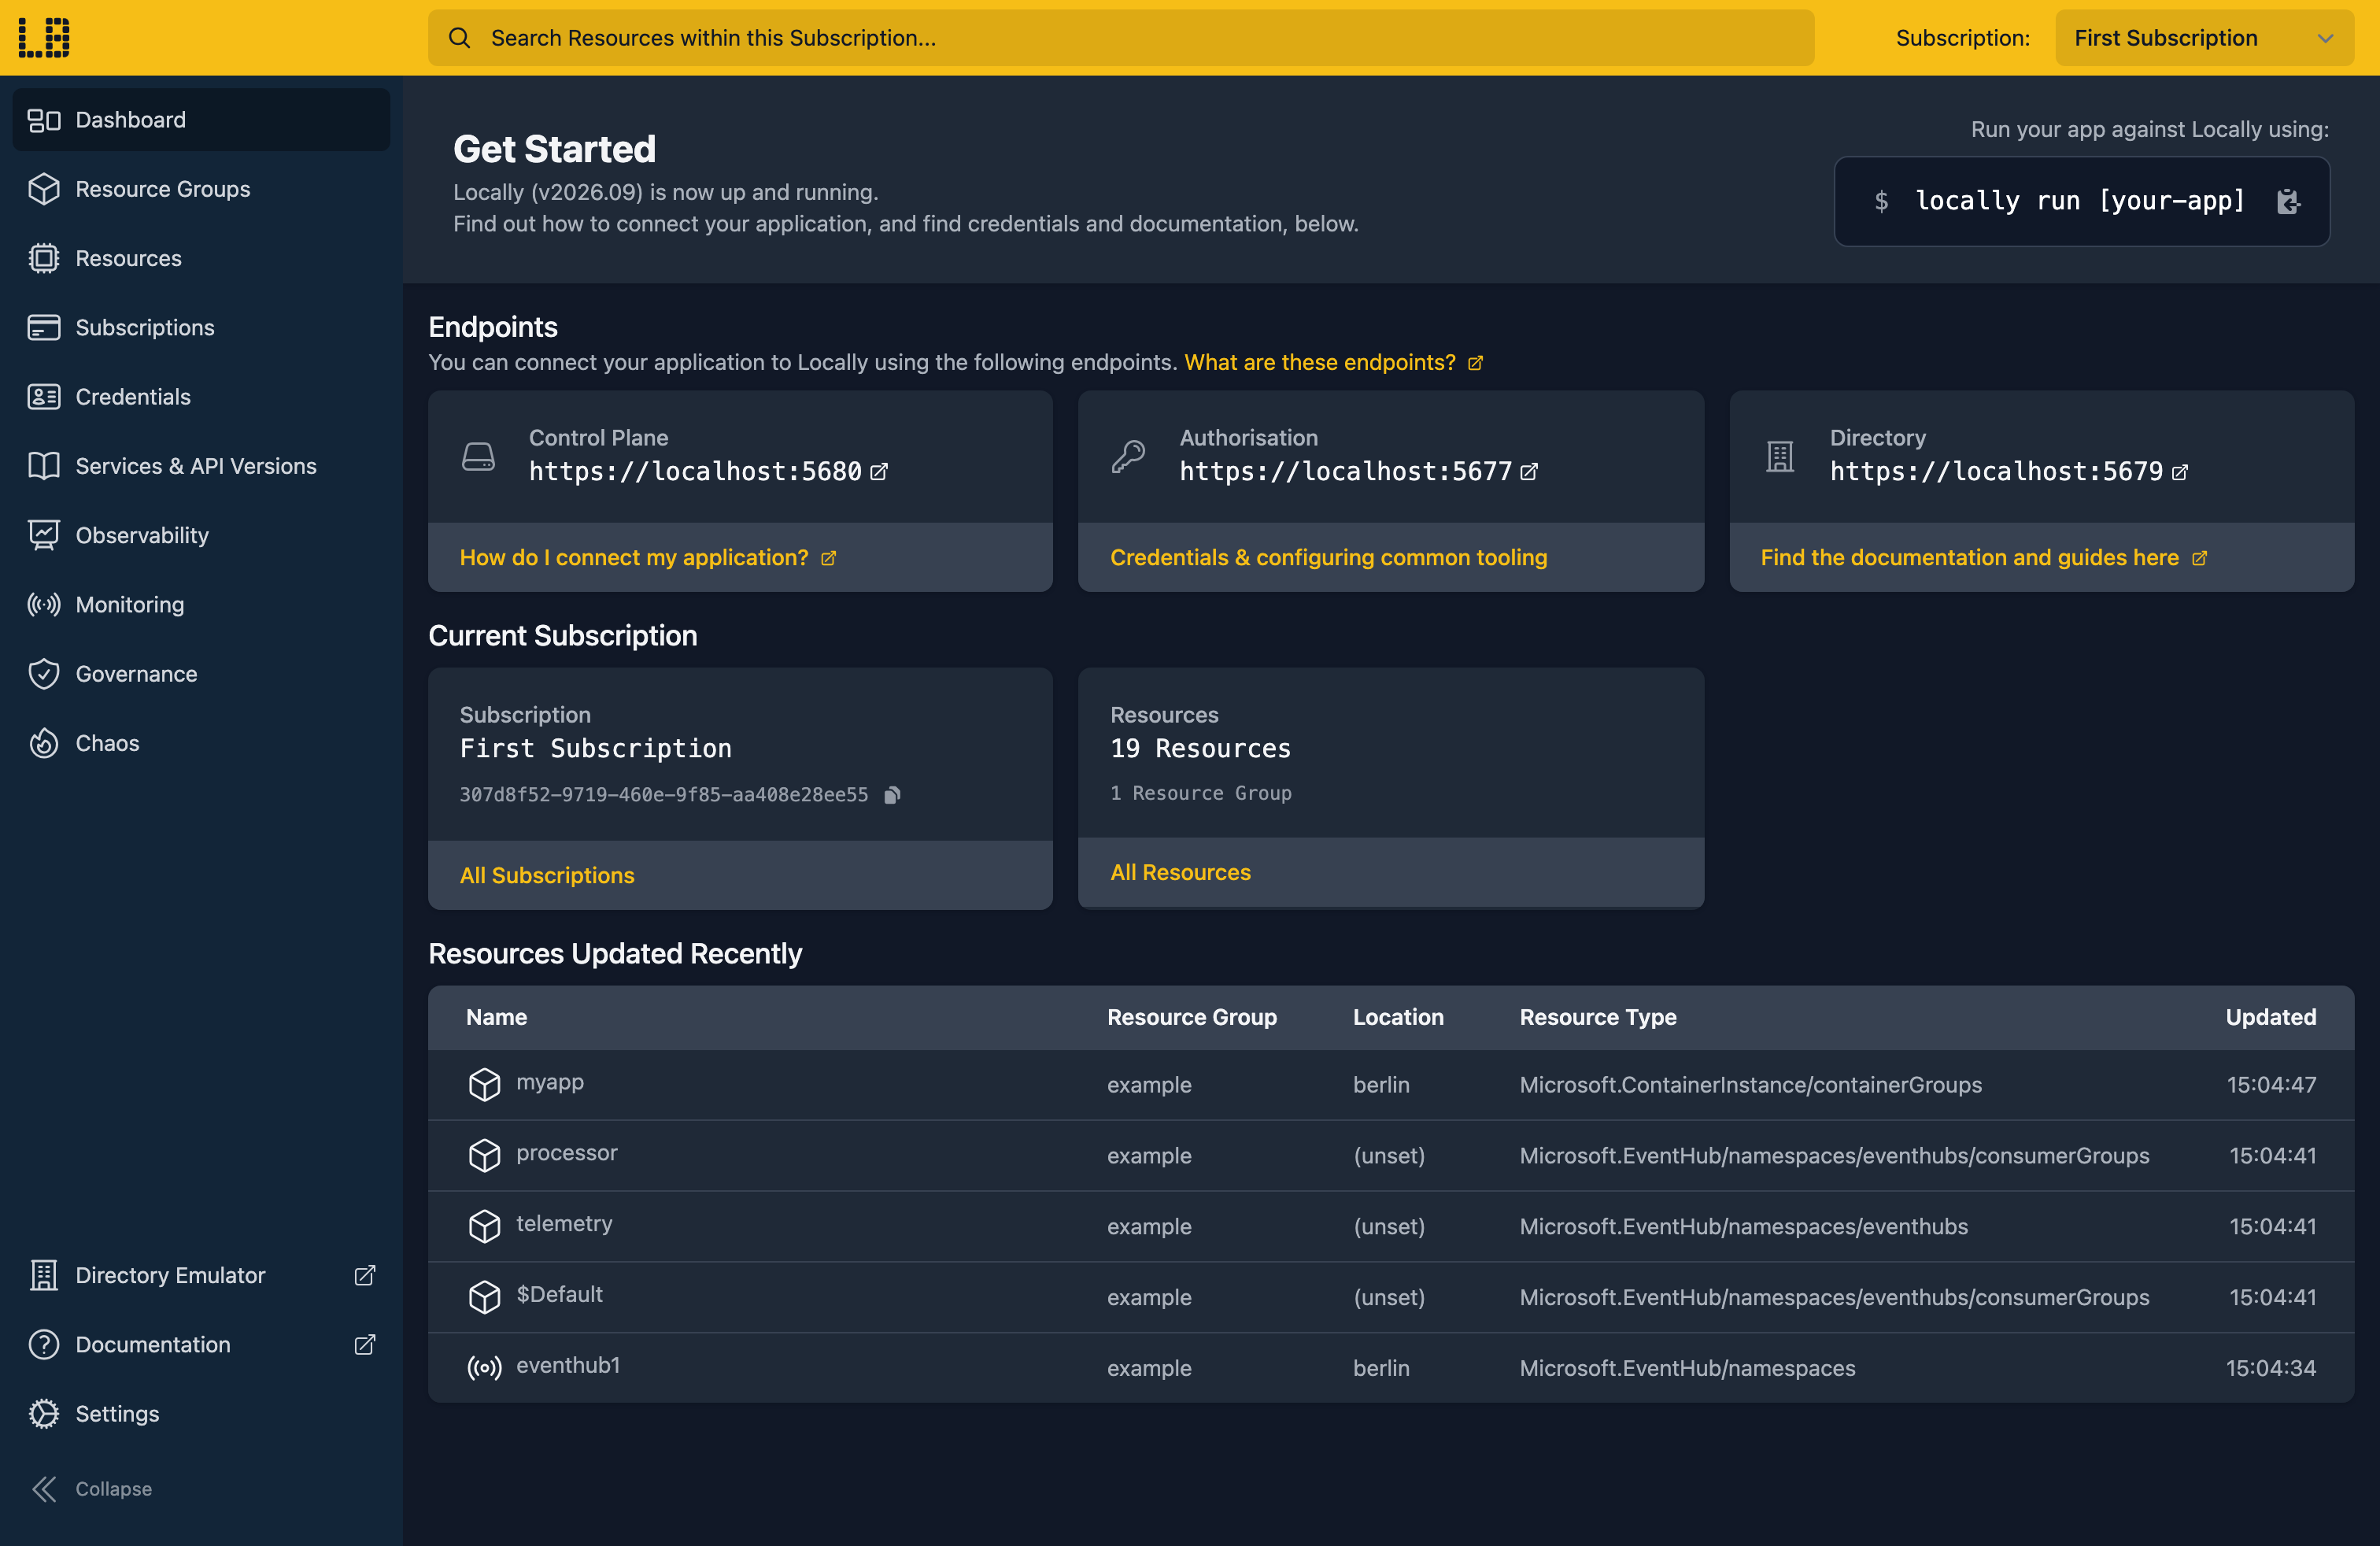
Once Locally has started, the Locally Dashboard will open automatically:
2. Create a Resource Group
Next we can create the Resource Group to hold the Action Group and the alert:
                $


            locally run az group create -n sample-alerts -l berlin
There's two things to note here:
- The Azure CLI supports Automatic Configuration, meaning that it can automatically be configured to work against Locally just by prefixing commands with
locally run. - Locally intentionally uses a different set of locations to Azure as a safety precaution, so that you can be confident you're deploying against Locally rather than regular Azure. You can also configure Locally to use the Azure locations too, but you'll want to be extra sure that you're prefixing commands with
locally runwhen you do.
3. Start a webhook receiver
An alert needs somewhere to go. We'll run a small echo server that logs every request it receives, listening on port 8099:
                $


            podman run -d --rm --name sample-alerts-webhook -p 8099:8080 docker.io/mendhak/http-https-echo
Locally sends webhook notifications from your machine, so a URL like http://localhost:8099 is reachable from it - there's no need to expose anything to the internet.
4. Create the Action Group
The Action Group says who gets told when an alert fires. This one has a webhook pointing at our receiver, using the common alert schema, and an email address for the on-call team:
                $


            locally run az monitor action-group create -g sample-alerts -n docs1-ops --short-name ops --action webhook ops-webhook http://localhost:8099/alerts usecommonalertschema --action email oncall [email protected]
{
  "note": "some fields skipped for brevity",

  "emailReceivers": [
    {
      "emailAddress": "[email protected]",
      "name": "oncall"
    }
  ],
  "name": "docs1-ops",
  "type": "Microsoft.Insights/actionGroups",
  "webhookReceivers": [
    {
      "name": "ops-webhook",
      "serviceUri": "http://localhost:8099/alerts",
      "useCommonAlertSchema": true
    }
  ]
}
Note
5. Create the Activity Log alert
Now for the alert itself. This one fires whenever the sample-alerts Resource Group is changed, and notifies the Action Group we just created:
                $


            locally run az monitor activity-log alert create -g sample-alerts -n docs1-group-changes --scope "/subscriptions/$(locally run az account show --query id -o tsv)/resourceGroups/sample-alerts" --condition category=Administrative and operationName=Microsoft.Resources/subscriptions/resourceGroups/write --action-group docs1-ops --description "Someone changed the sample-alerts resource group"
{
  "note": "some fields skipped for brevity",

  "condition": {
    "allOf": [
      {
        "equals": "Administrative",
        "field": "category"
      },
      {
        "equals": "Microsoft.Resources/subscriptions/resourceGroups/write",
        "field": "operationName"
      }
    ]
  },
  "enabled": true,
  "name": "docs1-group-changes",
  "scopes": [
    "/subscriptions/307d8f52-9719-460e-9f85-aa408e28ee55/resourceGroups/sample-alerts"
  ],
  "type": "Microsoft.Insights/activityLogAlerts"
}
The scopes are prefixes: any activity log event for a resource ID under the Resource Group is checked against the condition.
6. Trigger the alert
Adding a tag to the Resource Group is a write, which is exactly what the alert is watching for:
                $


            locally run az group update -n sample-alerts --tags owner=platform-team
Locally checks alert rules about once a minute, so give it a minute and then look at what the webhook received:
                $


            podman logs sample-alerts-webhook
The echo server logs the whole request. The body is the alert in the common alert schema, with the activity log event that triggered it as the alertContext:
{
  "note": "some fields skipped for brevity",

  "schemaId": "azureMonitorCommonAlertSchema",
  "data": {
    "essentials": {
      "monitorCondition": "Fired",
      "severity": "Sev4",
      "signalType": "Activity Log",
      "targetResourceName": "sample-alerts"
    },
    "alertContext": {
      "operationName": "Microsoft.Resources/subscriptions/resourceGroups/write",
      "status": "Succeeded"
    }
  }
}
The alert is also recorded as an Alerts Management alert, which we can list for the Resource Group:
                $


            locally run az rest --method get --url "/subscriptions/{subscriptionId}/providers/Microsoft.AlertsManagement/alerts?api-version=2025-05-25-preview&targetResourceGroup=sample-alerts" --query "value[].properties.essentials.{Target:targetResourceName, Signal:signalType, Severity:severity, Condition:monitorCondition, State:alertState}" -o table
Target         Signal        Severity    Condition    State
-------------  ------------  ----------  -----------  -------
sample-alerts  Activity Log  Sev4        Fired        New
Activity Log alerts always fire at Sev4 and never resolve on their own - each matching event fires once, the same as in Azure.
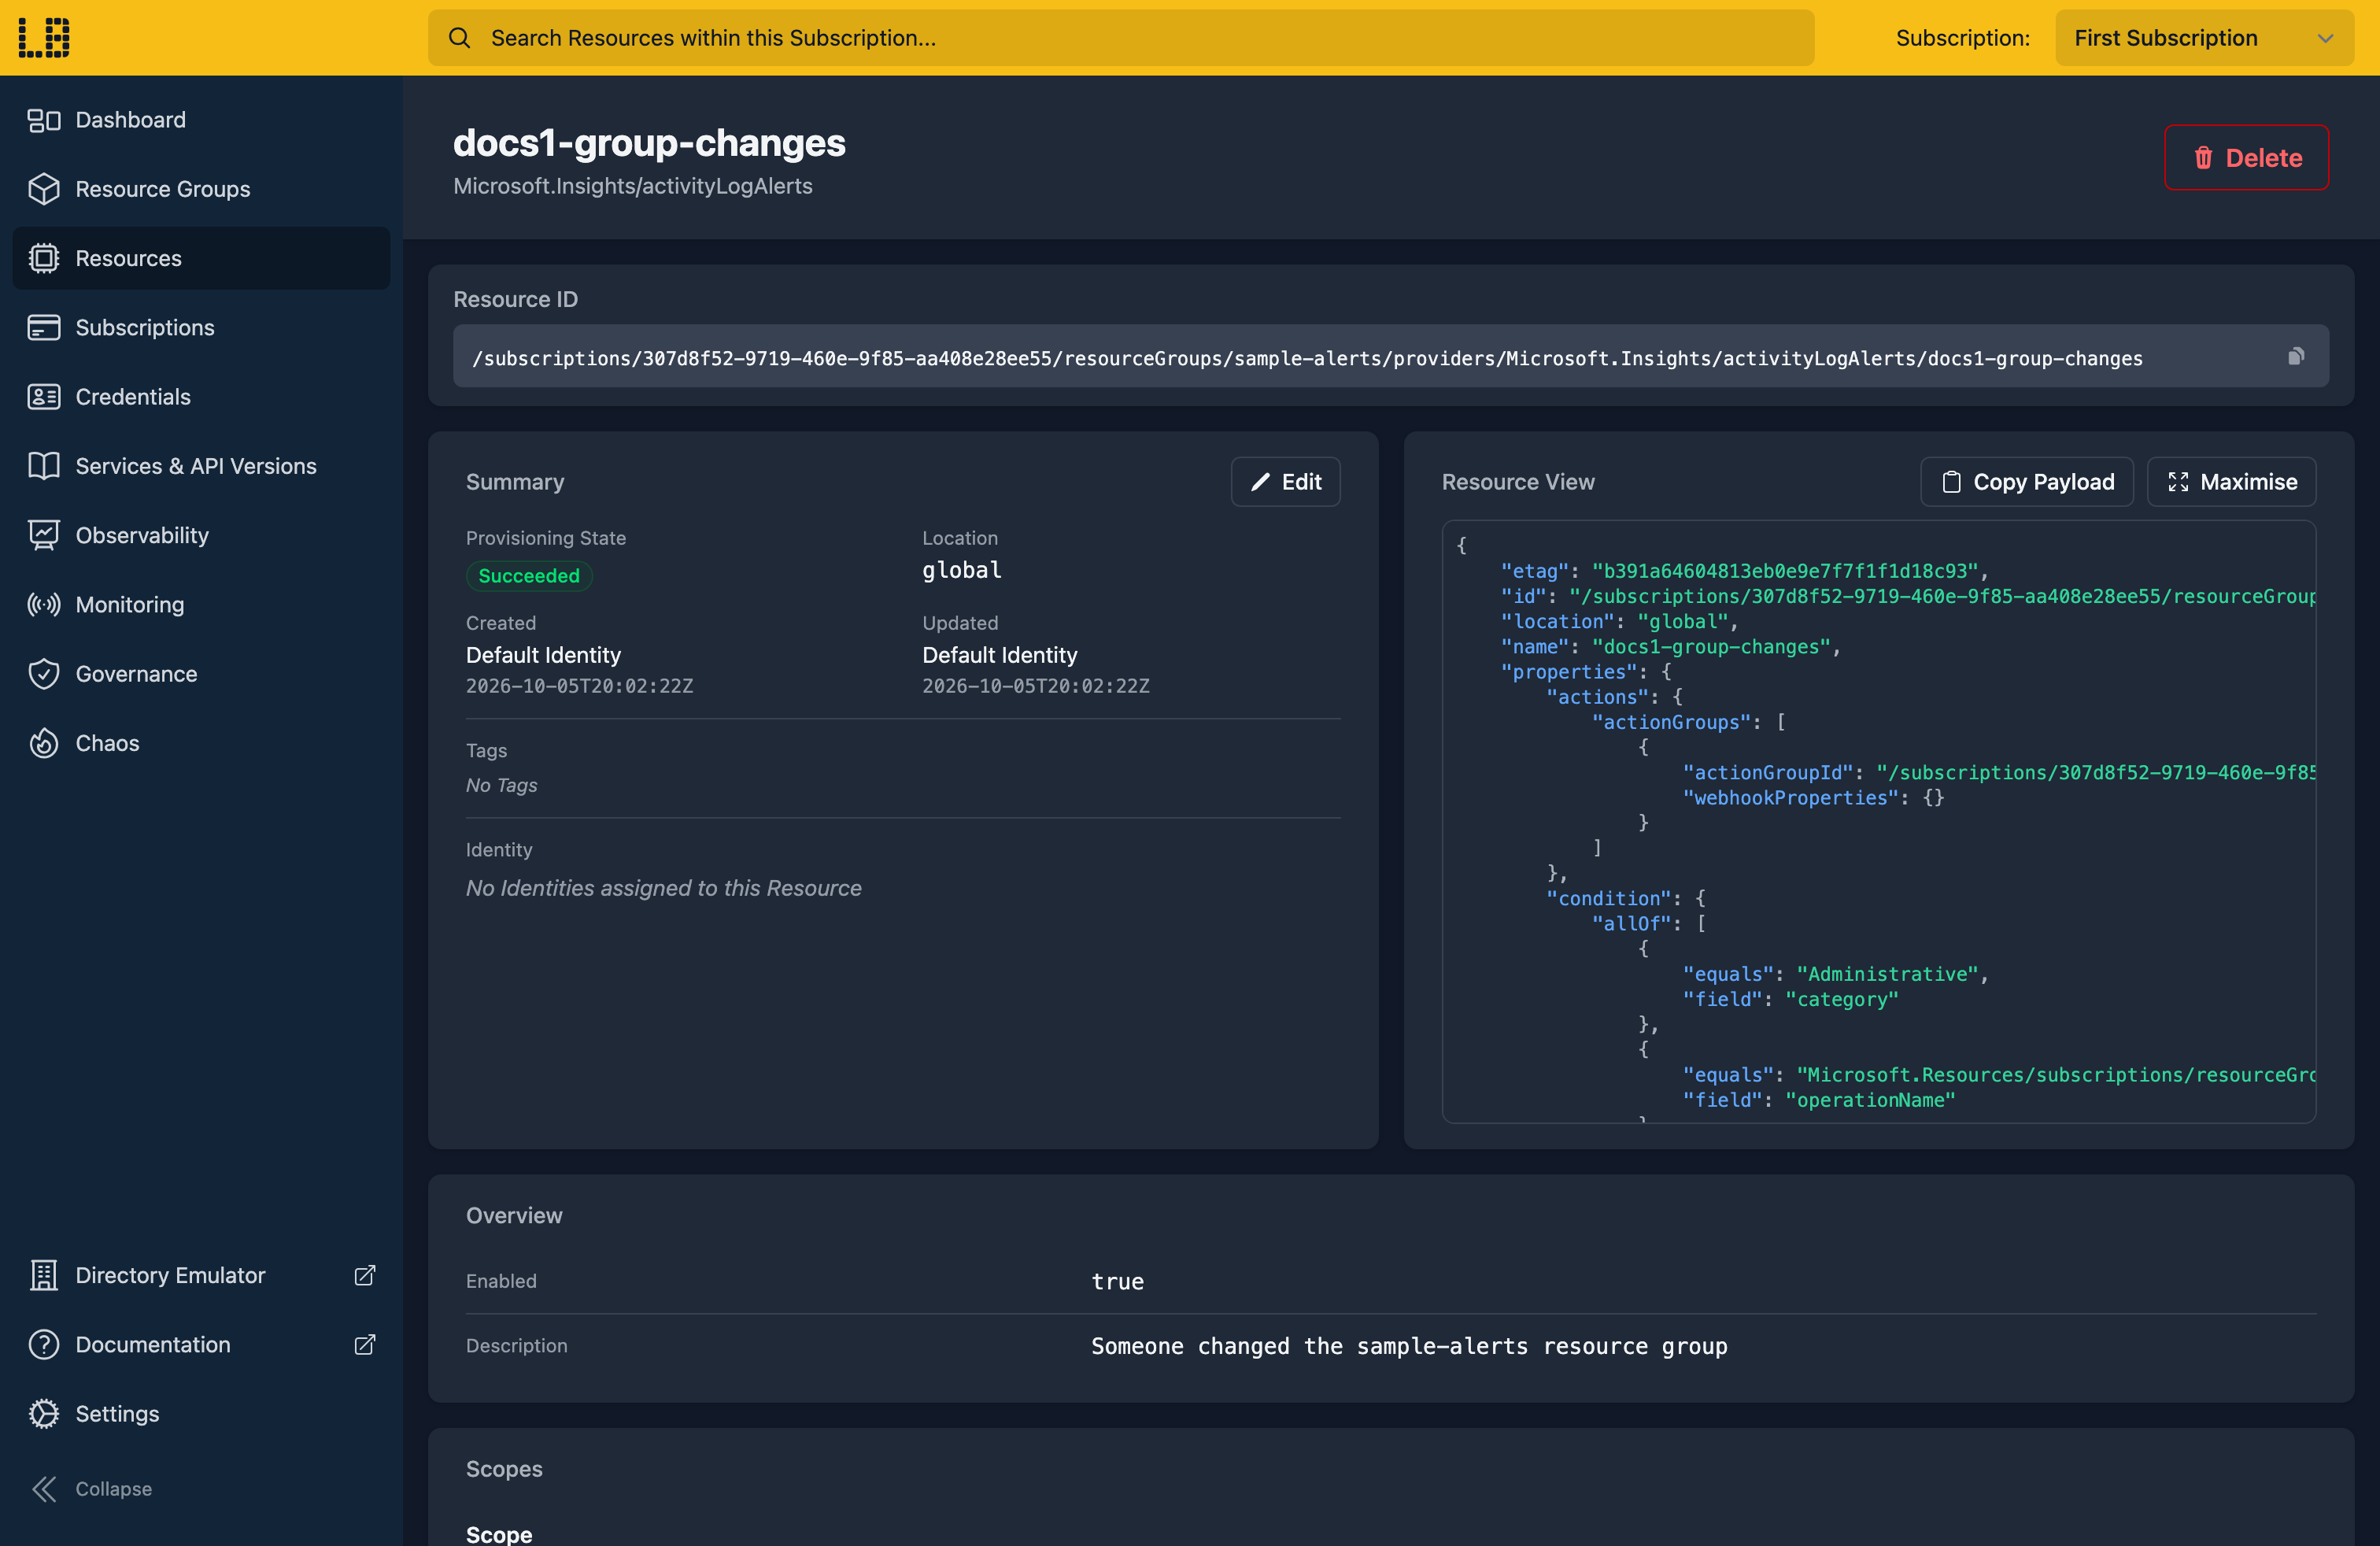
We can see the Activity Log alert in the Locally Dashboard too:
Doing this with other tooling
Whilst this guide used the Azure CLI, Action Groups and alerts work the same way through any of the tooling that Locally supports - Microsoft.Insights/actionGroups and Microsoft.Insights/activityLogAlerts resources in HashiCorp Terraform or OpenTofu, Pulumi, Bicep or an ARM Template all provision against Locally in the same way, with only the location changed.
Point the webhook at your own service instead of the echo server and you can test how it handles a real alert, without waiting for something to go wrong in Azure.
Next steps
To keep the Activity Log rather than alert on it, a Diagnostic Setting can send it to a Log Analytics Workspace - the Log Analytics Emulator shows where it lands.
Should you encounter any issues, please take a look at the troubleshooting section.
Sign in during Public Preview to get the Team plan free, plus an early-adopter discount when we launch. Sign in
